A look at how closely my CGM readings reflect actual blood glucose—and what that reveals about sensor placement and performance.
Abstract
Explore how well continuous glucose monitor (CGM) readings align with blood glucose meter (BGM) results, using real-world data and a 15-minute pairing window. By tracking percent differences and visualizing trends, it becomes easier to evaluate sensor placement, detect performance issues, and make more confident decisions.
Key Points
- CGM and BGM measure glucose in different body compartments, with CGM readings naturally lagging 5–15 minutes behind blood glucose levels.
- Even properly functioning sensors can show differences—up to 20% variance is considered acceptable under FDA and clinical standards.
- Pairing BGM and CGM readings within a 15-minute window helps identify when differences are expected and when they may indicate sensor issues.
- Sensor placement significantly affects accuracy, with some sites showing more consistent alignment than others.
- Tracking alignment over time supports better decision-making, helping to distinguish between natural fluctuations and device-related discrepancies.
When you use both a blood glucose meter (BGM) and a continuous glucose monitor (CGM), the numbers rarely match exactly. That’s not a sign that something is wrong—it’s a reflection of how these devices work.
A BGM measures glucose directly from a blood sample, while a CGM measures glucose in the interstitial fluid under your skin. Changes in glucose appear first in the blood, then in the interstitial fluid about 5 to 15 minutes later. Because of this lag, even a properly functioning sensor will sometimes read slightly higher or lower than a fingerstick taken at the same time.
Why I Compare BGM and CGM Readings
I run twice-daily BGM tests alongside my CGM to see how closely the readings align. This helps me evaluate sensor performance and decide which placement sites work best.
Good alignment means the CGM is performing well and the placement site is likely optimal.
Poor or inconsistent alignment may suggest the sensor is in a suboptimal location or experiencing performance issues.
The Method Behind the Match
Using a Python program, I pair each BGM reading with the closest CGM reading within a 15-minute window. This 15-minute window accounts for the natural lag between measurement types while still offering meaningful comparisons.
Once paired, I calculate the percent difference:
- Positive difference: CGM is reading higher than BGM.
- Negative difference: CGM is reading lower than BGM.
A difference of up to 20% is considered acceptable under FDA and clinical accuracy standards.
The program saves these results for visualization in Tableau, which allows me to see patterns over time and by sensor location.
What My Data Reveals
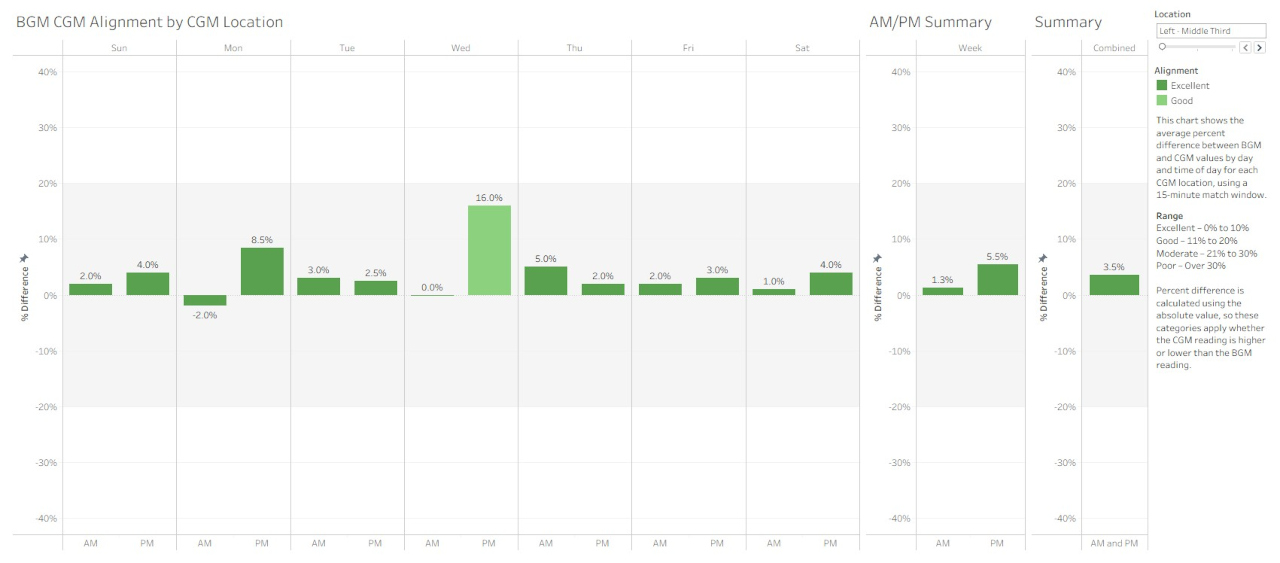
Two key visualizations help me interpret the results:
Daily Alignment Over a Rolling 7 Days – Shows percent difference for AM and PM readings by day, revealing short-term trends.
Average Alignment by Day and Location – Shows average percent differences grouped by day of week and by sensor site.
From my own experience with CGMs, I’ve noticed:
- New sensors often align well when first started, unless placed in a location that turns out to be less effective. One exception is the first night after insertion, when readings tend to run lower than expected.
- Some sensor locations provide consistently better alignment than others.
In sensor placement as in real estate, it’s location, location, location.
Why This Makes a Difference
Good CGM placement helps ensure the readings you see are as close as possible to what’s happening in your blood. Inaccurate or delayed readings can affect decision-making, especially during times when glucose is changing rapidly.
By tracking alignment, I can:
- Identify and avoid less effective sensor locations.
- Spot potential sensor issues early.
- Recognize whether differences are due to rapid glucose changes or device performance.
Putting It All Together
Tracking CGM-BGM alignment helps me understand what’s typical for me and my sensor. Small differences are normal. What matters is recognizing when they’re meaningful—and using that insight to make informed, confident decisions.
For more on the technical side of this approach, see the companion article at:
https://jcsanalytics.com/index.php/articles/aligning-cgm-and-bgm-readings-using-python-and-tableau
Links


